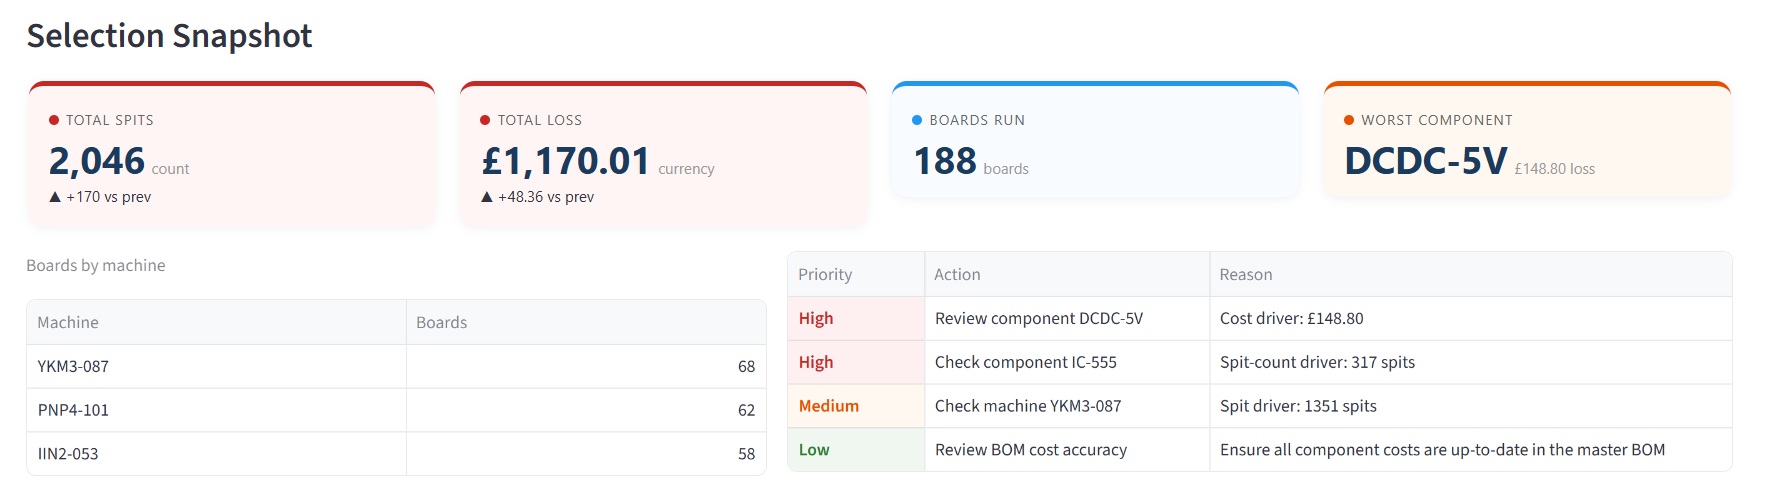
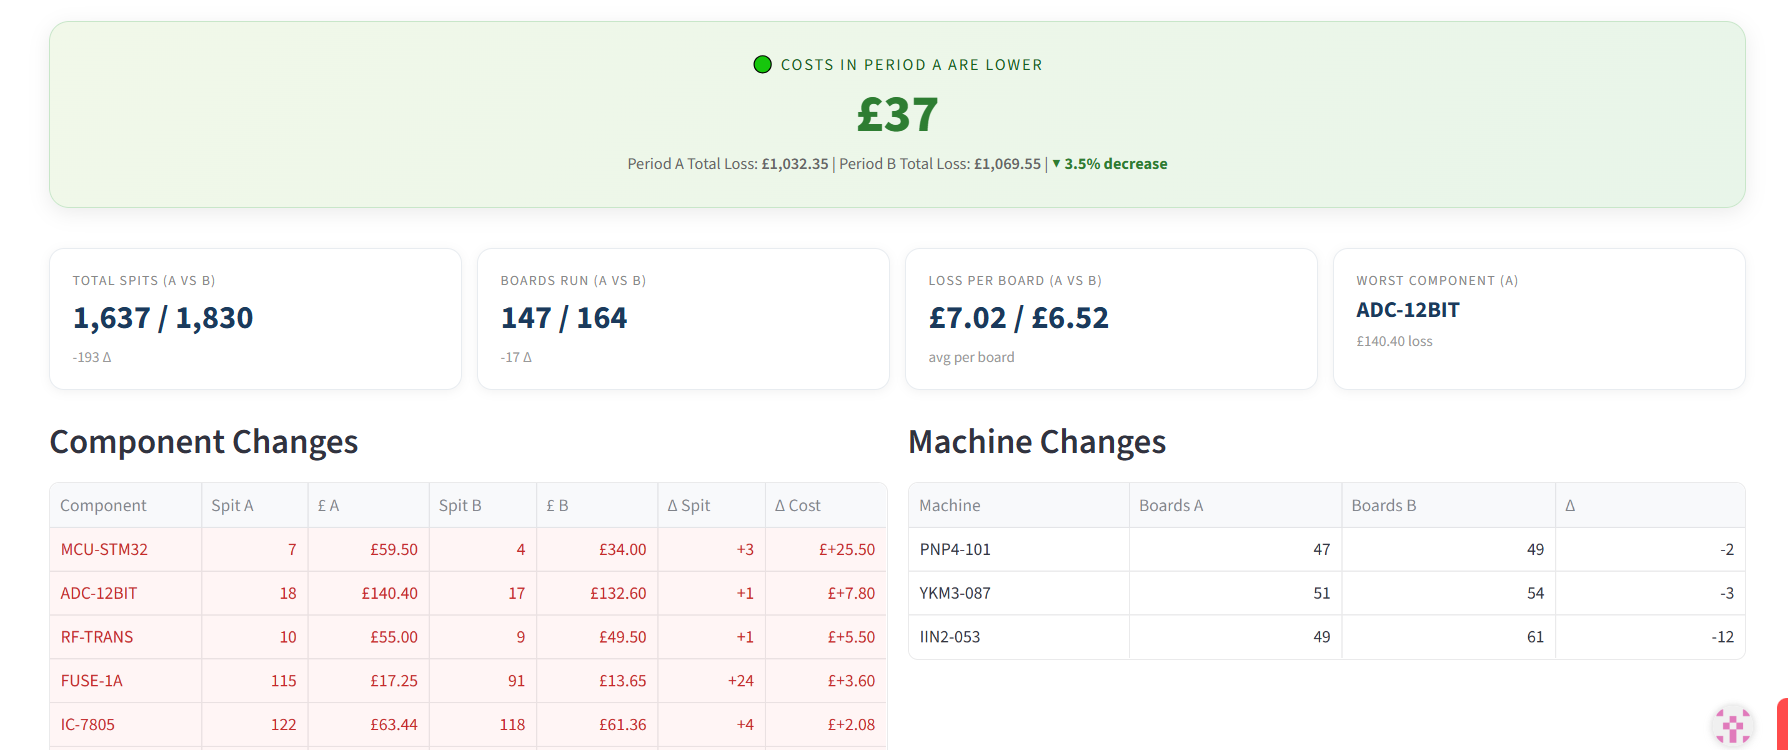
SMT Reject and Placement Intelligence

Proline Analytics

Proline Analytics is an SMT reject and placement analytics platform focused on detailed spit-out, reject, placement, and cost analysis. We convert raw machine events into practical engineering insight using advanced production filtering and module-based analytics.

Live Demo — No Installation Required

Try Proline Analytics right now

A fully functional demo with sample production data is live online. Explore all six analytics modules, apply filters, and experience the workflow — no download, no trial request, no commitment.

Filtering and Search

Narrow large datasets instantly

Use time, date, board, MO, and machine filters to isolate production data quickly and generate highly targeted analytics reports.

Time and date selection

Zoom into specific shifts, production periods, or incident windows so reject analysis matches real shopfloor events.

Board, MO, and machine filters

Filter by board name, manufacturing order, and machine selection to analyse one run or compare multiple production conditions.

Optional cost integration

Add a customer-provided component pricing file, such as a master BOM with unit pricing, to unlock reject and placement cost analysis.

Proline Analytics selection interface

Analytics Modules

Module-based analysis built for action

Six focused modules covering KPI overview, placement performance, full event traceability, recurring failure patterns, period comparison, and reject hotspot mapping.

Summary

KPI cards for high-level visibility of reject totals, cost impact, and machine usage. Includes a corrective action monitor — select any component and track its spitout rate over time to verify if fixes are working.

Successful Placements

Analyse successfully placed components with placement quantities, board-level statistics, and component value. Includes spit-to-success ratio per component for a clear view of placement health.

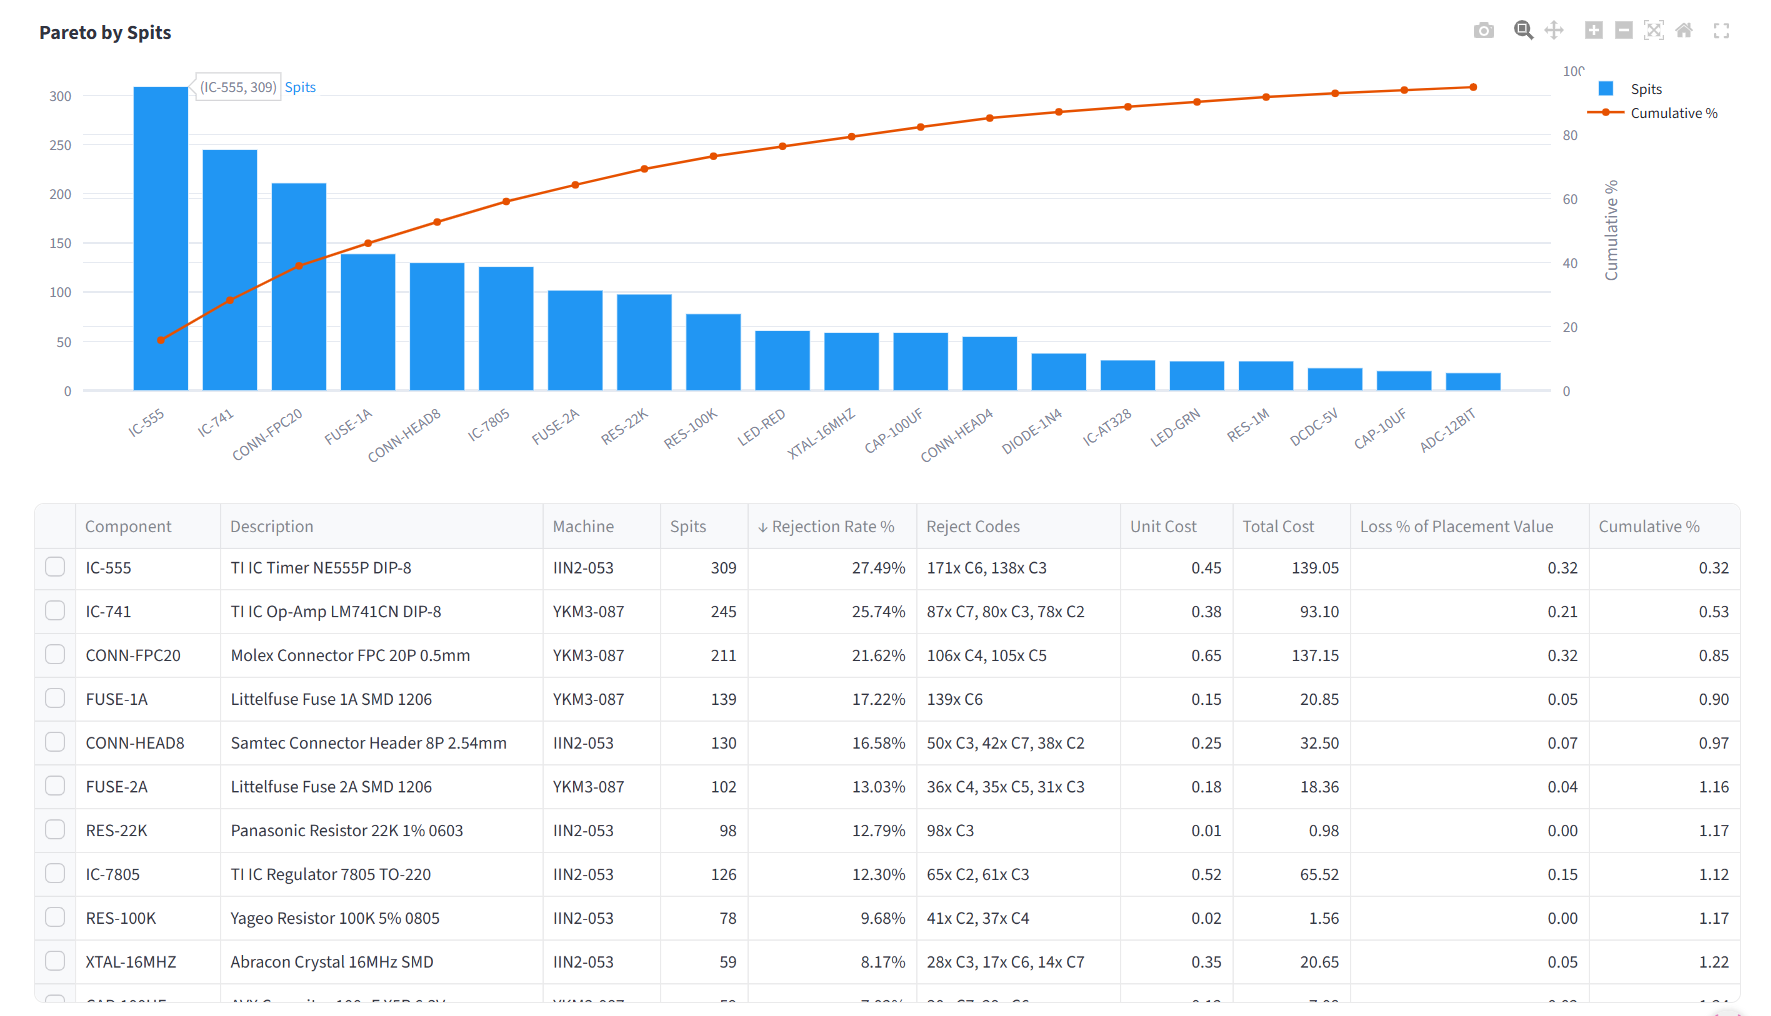
Individual Spit Events

Full traceability for every reject and spit event — component description, PCB location, trolley and feeder slot, board name, MO, machine, date, timestamp, reject reason, and cost.

Proline Analytics dashboard overview

Repeated Locations

Identify recurring reject positions and repeated placement failures on the PCB to isolate persistent issues and support faster root-cause investigation.

Period Comparison

Compare two date and time periods side by side for any run. View spitout comparison, cost comparison, loss per board comparison, and overlaid spit timeline graphs for both periods.

Heatmap of Trolleys & Slots

Visual reject hotspot mapping across machine trolleys and feeder slots. Toggle between Reject Count and Cost Impact modes, hover for feeder number, slot number, spit count, reject cost, and top component details.

Proline Analytics period comparison

Reporting and Export

Export structured analytics in one step

Generate automated Excel reports with structured multi-sheet reporting, full analytics export functionality, and integrated Pareto chart analysis of rejection trends.